

Databricks-Certified-Data-Analyst-Associate Practice Dumps - Verified By ValidBraindumps Updated 67 Questions
Updated Databricks-Certified-Data-Analyst-Associate Exam Dumps - PDF Questions and Testing Engine
NEW QUESTION # 20
Which statement describes descriptive statistics?
- A. A branch of statistics that uses summary statistics to quantitatively describe and summarize data.
- B. A branch of statistics that uses a variety of data analysis techniques to infer properties of an underlying distribution of probability.
- C. A branch of statistics that uses summary statistics to categorically describe and summarize data.
- D. A branch of statistics that uses quantitative variables that must take on a finite or countably infinite set of values.
Answer: A
NEW QUESTION # 21
Which of the following should data analysts consider when working with personally identifiable information (PII) data?
- A. All of these considerations
- B. Organization-specific best practices for Pll data
- C. Legal requirements for the area in which the data was collected
- D. Legal requirements for the area in which the analysis is being performed
- E. None of these considerations
Answer: A
Explanation:
Data analysts should consider all of these factors when working with PII data, as they may affect the data security, privacy, compliance, and quality. PII data is any information that can be used to identify a specific individual, such as name, address, phone number, email, social security number, etc. PII data may be subject to different legal and ethical obligations depending on the context and location of the data collection and analysis. For example, some countries or regions may have stricter data protection laws than others, such as the General Data Protection Regulation (GDPR) in the European Union. Data analysts should also follow the organization-specific best practices for PII data, such as encryption, anonymization, masking, access control, auditing, etc. These best practices can help prevent data breaches, unauthorized access, misuse, or loss of PII data. Reference:
How to Use Databricks to Encrypt and Protect PII Data
Automating Sensitive Data (PII/PHI) Detection
Databricks Certified Data Analyst Associate
NEW QUESTION # 22
A data analyst created and is the owner of the managed table my_ table. They now want to change ownership of the table to a single other user using Data Explorer.
Which of the following approaches can the analyst use to complete the task?
- A. Edit the Owner field in the table page by removing all access
- B. Edit the Owner field in the table page by removing their own account
- C. Edit the Owner field in the table page by selecting All Users
- D. Edit the Owner field in the table page by selecting the new owner's account
- E. Edit the Owner field in the table page by selecting the Admins group
Answer: D
Explanation:
The Owner field in the table page shows the current owner of the table and allows the owner to change it to another user or group. To change the ownership of the table, the owner can click on the Owner field and select the new owner from the drop-down list. This will transfer the ownership of the table to the selected user or group and remove the previous owner from the list of table access control entries1. The other options are incorrect because:
A . Removing the owner's account from the Owner field will not change the ownership of the table, but will make the table ownerless2.
B . Selecting All Users from the Owner field will not change the ownership of the table, but will grant all users access to the table3.
D . Selecting the Admins group from the Owner field will not change the ownership of the table, but will grant the Admins group access to the table3.
E . Removing all access from the Owner field will not change the ownership of the table, but will revoke all access to the table4. Reference:
1: Change table ownership
2: Ownerless tables
3: Table access control
4: Revoke access to a table
NEW QUESTION # 23
A data analyst is processing a complex aggregation on a table with zero null values and their query returns the following result:
Which of the following queries did the analyst run to obtain the above result?
- A.

- B.

- C.

- D.

- E.

Answer: D
Explanation:
The result set provided shows a combination of grouping by two columns (group_1 and group_2) with subtotals for each level of grouping and a grand total. This pattern is typical of a GROUP BY ... WITH ROLLUP operation in SQL, which provides subtotal rows and a grand total row in the result set.
Considering the query options:
A) Option A: GROUP BY group_1, group_2 INCLUDING NULL - This is not a standard SQL clause and would not result in subtotals and a grand total.
B) Option B: GROUP BY group_1, group_2 WITH ROLLUP - This would create subtotals for each unique group_1, each combination of group_1 and group_2, and a grand total, which matches the result set provided.
C) Option C: GROUP BY group_1, group 2 - This is a simple GROUP BY and would not include subtotals or a grand total.
D) Option D: GROUP BY group_1, group_2, (group_1, group_2) - This syntax is not standard and would likely result in an error or be interpreted as a simple GROUP BY, not providing the subtotals and grand total.
E) Option E: GROUP BY group_1, group_2 WITH CUBE - The WITH CUBE operation produces subtotals for all combinations of the selected columns and a grand total, which is more than what is shown in the result set.
The correct answer is Option B, which uses WITH ROLLUP to generate the subtotals for each level of grouping as well as a grand total. This matches the result set where we have subtotals for each group_1, each combination of group_1 and group_2, and the grand total where both group_1 and group_2 are NULL.
NEW QUESTION # 24
Which of the following statements about adding visual appeal to visualizations in the Visualization Editor is incorrect?
- A. Borders can be added.
- B. Data Labels can be formatted.
- C. Colors can be changed.
- D. Visualization scale can be changed.
- E. Tooltips can be formatted.
Answer: A
Explanation:
The Visualization Editor in Databricks SQL allows users to create and customize various types of charts and visualizations from the query results. Users can change the visualization type, select the data fields, adjust the colors, format the data labels, and modify the tooltips. However, there is no option to add borders to the visualizations in the Visualization Editor. Borders are not a supported feature of the new chart visualizations in Databricks1. Therefore, the statement that borders can be added is incorrect. Reference:
New chart visualizations in Databricks | Databricks on AWS
NEW QUESTION # 25
A data analyst is working with gold-layer tables to complete an ad-hoc project. A stakeholder has provided the analyst with an additional dataset that can be used to augment the gold-layer tables already in use.
Which of the following terms is used to describe this data augmentation?
- A. Last-mile
- B. Last-mile ETL
- C. Data enhancement
- D. Data testing
- E. Ad-hoc improvements
Answer: C
Explanation:
Data enhancement is the process of adding or enriching data with additional information to improve its quality, accuracy, and usefulness. Data enhancement can be used to augment existing data sources with new data sources, such as external datasets, synthetic data, or machine learning models. Data enhancement can help data analysts to gain deeper insights, discover new patterns, and solve complex problems. Data enhancement is one of the applications of generative AI, which can leverage machine learning to generate synthetic data for better models or safer data sharing1.
In the context of the question, the data analyst is working with gold-layer tables, which are curated business-level tables that are typically organized in consumption-ready project-specific databases234. The gold-layer tables are the final layer of data transformations and data quality rules in the medallion lakehouse architecture, which is a data design pattern used to logically organize data in a lakehouse2. The stakeholder has provided the analyst with an additional dataset that can be used to augment the gold-layer tables already in use. This means that the analyst can use the additional dataset to enhance the existing gold-layer tables with more information, such as new features, attributes, or metrics. This data augmentation can help the analyst to complete the ad-hoc project more effectively and efficiently.
Reference:
What is the medallion lakehouse architecture? - Databricks
Data Warehousing Modeling Techniques and Their Implementation on the Databricks Lakehouse Platform | Databricks Blog What is the medallion lakehouse architecture? - Azure Databricks What is a Medallion Architecture? - Databricks Synthetic Data for Better Machine Learning | Databricks Blog
NEW QUESTION # 26
What describes the variance of a set of values?
- A. Variance is a measure of how far a single observed value is from a set ot va IN
- B. Variance is a measure of central tendency of a set of values.
- C. Variance is a measure of how far an observed value is from the variable's maximum or minimum value.
- D. Variance is a measure of how far a set of values is spread out from the sets central value.
Answer: D
Explanation:
Variance is a statistical measure that quantifies the dispersion or spread of a set of values around their mean (central value). It is calculated by taking the average of the squared differences between each value and the mean of the dataset. A higher variance indicates that the data points are more spread out from the mean, while a lower variance suggests that they are closer to the mean. This measure is fundamental in statistics to understand the degree of variability within a dataset.WikipediaWikipedia+1Investopedia+1
NEW QUESTION # 27
A data analyst created and is the owner of the managed table my_ table. They now want to change ownership of the table to a single other user using Data Explorer.
Which of the following approaches can the analyst use to complete the task?
- A. Edit the Owner field in the table page by removing all access
- B. Edit the Owner field in the table page by removing their own account
- C. Edit the Owner field in the table page by selecting All Users
- D. Edit the Owner field in the table page by selecting the new owner's account
- E. Edit the Owner field in the table page by selecting the Admins group
Answer: D
Explanation:
The Owner field in the table page shows the current owner of the table and allows the owner to change it to another user or group. To change the ownership of the table, the owner can click on the Owner field and select the new owner from the drop-down list. This will transfer the ownership of the table to the selected user or group and remove the previous owner from the list of table access control entries1. The other options are incorrect because:
A) Removing the owner's account from the Owner field will not change the ownership of the table, but will make the table ownerless2.
B) Selecting All Users from the Owner field will not change the ownership of the table, but will grant all users access to the table3.
D) Selecting the Admins group from the Owner field will not change the ownership of the table, but will grant the Admins group access to the table3.
E) Removing all access from the Owner field will not change the ownership of the table, but will revoke all access to the table4. Reference:
1: Change table ownership
2: Ownerless tables
3: Table access control
4: Revoke access to a table
NEW QUESTION # 28
A data engineering team has created a Structured Streaming pipeline that processes data in micro-batches and populates gold-level tables. The microbatches are triggered every minute.
A data analyst has created a dashboard based on this gold-level dat
a. The project stakeholders want to see the results in the dashboard updated within one minute or less of new data becoming available within the gold-level tables.
Which of the following cautions should the data analyst share prior to setting up the dashboard to complete this task?
- A. The gold-level tables are not appropriately clean for business reporting
- B. The streaming cluster is not fault tolerant
- C. The streaming data is not an appropriate data source for a dashboard
- D. The required compute resources could be costly
- E. The dashboard cannot be refreshed that quickly
Answer: D
Explanation:
A Structured Streaming pipeline that processes data in micro-batches and populates gold-level tables every minute requires a high level of compute resources to handle the frequent data ingestion, processing, and writing. This could result in a significant cost for the organization, especially if the data volume and velocity are large. Therefore, the data analyst should share this caution with the project stakeholders before setting up the dashboard and evaluate the trade-offs between the desired refresh rate and the available budget. The other options are not valid cautions because:
B . The gold-level tables are assumed to be appropriately clean for business reporting, as they are the final output of the data engineering pipeline. If the data quality is not satisfactory, the issue should be addressed at the source or silver level, not at the gold level.
C . The streaming data is an appropriate data source for a dashboard, as it can provide near real-time insights and analytics for the business users. Structured Streaming supports various sources and sinks for streaming data, including Delta Lake, which can enable both batch and streaming queries on the same data.
D . The streaming cluster is fault tolerant, as Structured Streaming provides end-to-end exactly-once fault-tolerance guarantees through checkpointing and write-ahead logs. If a query fails, it can be restarted from the last checkpoint and resume processing.
E . The dashboard can be refreshed within one minute or less of new data becoming available in the gold-level tables, as Structured Streaming can trigger micro-batches as fast as possible (every few seconds) and update the results incrementally. However, this may not be necessary or optimal for the business use case, as it could cause frequent changes in the dashboard and consume more resources. Reference: Streaming on Databricks, Monitoring Structured Streaming queries on Databricks, A look at the new Structured Streaming UI in Apache Spark 3.0, Run your first Structured Streaming workload
NEW QUESTION # 29
Which of the following statements describes descriptive statistics?
- A. A branch of statistics that uses quantitative variables that must take on an uncountable set of values.
- B. A branch of statistics that uses summary statistics to quantitatively describe and summarize data.
- C. A branch of statistics that uses a variety of data analysis techniques to infer properties of an underlying distribution of probability.
- D. A branch of statistics that uses summary statistics to categorically describe and summarize data.
- E. A branch of statistics that uses quantitative variables that must take on a finite or countably infinite set of values.
Answer: B
Explanation:
Descriptive statistics is a branch of statistics that uses summary statistics, such as mean, median, mode, standard deviation, range, frequency, or correlation, to quantitatively describe and summarize data. Descriptive statistics can help data analysts understand the main features of a data set, such as its central tendency, variability, or distribution. Descriptive statistics can also help data analysts visualize data using charts, graphs, or tables. Descriptive statistics do not make any inferences or predictions about the data, unlike inferential statistics, which use data analysis techniques to infer properties of an underlying population or probability distribution from a sample of data. Reference: Databricks - Descriptive Statistics, Databricks - Data Analysis with Databricks SQL
NEW QUESTION # 30
What is used as a compute resource for Databricks SQL?
- A. Single-node clusters
- B. SQL warehouses
- C. Standard clusters
- D. Downstream BI tools integrated with Databricks SQL
Answer: B
NEW QUESTION # 31
What describes Partner Connect in Databricks?
- A. it allows for free use of Databricks partner tools through a common API.
- B. it allows multi-directional connection between Databricks and Databricks partners easier.
- C. It is a feature that runs Databricks partner tools on a Databricks SQL Warehouse (formerly known as a SQL endpoint).
- D. It exposes connection information to third-party tools via Databricks partners.
Answer: B
Explanation:
Databricks Partner Connect is designed to simplify and streamline the integration between Databricks and its technology partners. It provides a unified interface within the Databricks platform that facilitates the discovery and connection to a variety of data, analytics, and AI tools. By automating the configuration of necessary resources such as clusters, tokens, and connection files, Partner Connect enables seamless, bi-directional data flow between Databricks and partner solutions. This integration enhances the overall functionality of the Databricks Lakehouse by allowing users to easily incorporate external tools and services into their workflows, thereby expanding the platform's capabilities and fostering a more cohesive data ecosystem.https://www.databricks.com/blog/2021/11/18/now-generally-available-introducing-databricks-partner-connect-to-discover-and-connect-popular-data-and-ai-tools-to-the-lakehouse?utm_source=chatgpt.com
NEW QUESTION # 32
A data organization has a team of engineers developing data pipelines following the medallion architecture using Delta Live Tables. While the data analysis team working on a project is using gold-layer tables from these pipelines, they need to perform some additional processing of these tables prior to performing their analysis.
Which of the following terms is used to describe this type of work?
- A. Last-mile
- B. Last-mile ETL
- C. Data blending
- D. Data enhancement
- E. Data testing
Answer: B
Explanation:
Last-mile ETL is the term used to describe the additional processing of data that is done by data analysts or data scientists after the data has been ingested, transformed, and stored in the lakehouse by data engineers. Last-mile ETL typically involves tasks such as data cleansing, data enrichment, data aggregation, data filtering, or data sampling that are specific to the analysis or machine learning use case. Last-mile ETL can be done using Databricks SQL, Databricks notebooks, or Databricks Machine Learning. Reference: Databricks - Last-mile ETL, Databricks - Data Analysis with Databricks SQL
NEW QUESTION # 33
A data analyst has recently joined a new team that uses Databricks SQL, but the analyst has never used Databricks before. The analyst wants to know where in Databricks SQL they can write and execute SQL queries.
On which of the following pages can the analyst write and execute SQL queries?
- A. Dashboards page
- B. SQL Editor page
- C. Alerts page
- D. Queries page
- E. Data page
Answer: B
Explanation:
The SQL Editor page is where the analyst can write and execute SQL queries in Databricks SQL. The SQL Editor page has a query pane where the analyst can type or paste SQL statements, and a results pane where the analyst can view the query results in a table or a chart. The analyst can also browse data objects, edit multiple queries, execute a single query or multiple queries, terminate a query, save a query, download a query result, and more from the SQL Editor page. Reference: Create a query in SQL editor
NEW QUESTION # 34
The stakeholders.customers table has 15 columns and 3,000 rows of dat
a. The following command is run:
After running SELECT * FROM stakeholders.eur_customers, 15 rows are returned. After the command executes completely, the user logs out of Databricks.
After logging back in two days later, what is the status of the stakeholders.eur_customers view?
- A. The view has been converted into a table.
- B. The view has been dropped.
- C. The view remains available but attempting to SELECT from it results in an empty result set because data in views are automatically deleted after logging out.
- D. The view remains available and SELECT * FROM stakeholders.eur_customers will execute correctly.
- E. The view is not available in the metastore, but the underlying data can be accessed with SELECT * FROM delta. `stakeholders.eur_customers`.
Answer: D
Explanation:
In Databricks, a view is a saved SQL query definition that references existing tables or other views. Once created, a view remains persisted in the metastore (such as Unity Catalog or Hive Metastore) until it is explicitly dropped.
Key points:
Views do not store data themselves but reference data from underlying tables.
Logging out or being inactive does not delete or alter views.
Unless a user or admin explicitly drops the view or the underlying data/table is deleted, the view continues to function as expected.
Therefore, after logging back in-even days later-a user can still run SELECT * FROM stakeholders.eur_customers, and it will return the same data (provided the underlying table hasn't changed).
NEW QUESTION # 35
A data analyst has created a user-defined function using the following line of code:
CREATE FUNCTION price(spend DOUBLE, units DOUBLE)
RETURNS DOUBLE
RETURN spend / units;
Which of the following code blocks can be used to apply this function to the customer_spend and customer_units columns of the table customer_summary to create column customer_price?
- A. SELECT double(price(customer_spend, customer_units)) AS customer_price FROM customer_summary
- B. SELECT price FROM customer_summary
- C. SELECT PRICE customer_spend, customer_units AS customer_price FROM customer_summary
- D. SELECT function(price(customer_spend, customer_units)) AS customer_price FROM customer_summary
- E. SELECT price(customer_spend, customer_units) AS customer_price FROM customer_summary
Answer: E
Explanation:
A user-defined function (UDF) is a function defined by a user, allowing custom logic to be reused in the user environment1. To apply a UDF to a table, the syntax is SELECT udf_name(column_name) AS alias FROM table_name2. Therefore, option E is the correct way to use the UDF price to create a new column customer_price based on the existing columns customer_spend and customer_units from the table customer_summary. Reference:
What are user-defined functions (UDFs)?
User-defined scalar functions - SQL
V
NEW QUESTION # 36
Which statement about subqueries is correct?
- A. Subqueries can be used like other built-in functions to transform data into different data types.
- B. Subqueries are not available in Databricks SQL
- C. Subqueries can be used like other user-defined functions to transform data into different data types.
- D. Subqueries can retrieve data without requiring the creation of a table or view.
Answer: D
Explanation:
In Databricks SQL, a subquery is a nested query within a larger SQL query that allows for the retrieval of data without the necessity of creating a table or view. This is particularly useful for simplifying complex queries by breaking them down into more manageable parts. Subqueries can be employed in various clauses such as SELECT, FROM, and WHERE to perform operations like filtering, transforming, and aggregating data on-the-fly. This flexibility enhances query efficiency and readability without the overhead of persisting intermediate results as separate tables or views.
NEW QUESTION # 37
A data analyst has been asked to configure an alert for a query that returns the income in the accounts_receivable table for a date range. The date range is configurable using a Date query parameter.
The Alert does not work.
Which of the following describes why the Alert does not work?
- A. The wrong query parameter is being used. Alerts only work with Date and Time query parameters.
- B. Alerts don't work with queries that access tables.
- C. The wrong query parameter is being used. Alerts only work with drogdown list query parameters, not dates.
- D. Queries that use query parameters cannot be used with Alerts.
- E. Queries that return results based on dates cannot be used with Alerts.
Answer: D
Explanation:
The reason the alert is not functioning as expected is because Databricks SQL Alerts do not support query parameters. This limitation applies to all types of parameters, including date parameters.
Here's why:
Alerts require static, deterministic query results so they can compare values consistently during scheduled executions.
When a query includes parameters (e.g., a date range parameter), its results may change based on user input or the default value set in the query editor.
However, Databricks SQL Alerts will always use the default value set for the parameter at the time the alert is created. This means the alert doesn't dynamically adapt to new date ranges and will not reflect changes unless the query is manually updated.
As a result, if the business logic behind the alert depends on changing date ranges or any user input, the alert will not trigger correctly, or may never trigger at all.
Therefore, the correct explanation contradicts Option B, which is incorrect in saying that alerts cannot work with date-based queries at all. In fact, they can-as long as the query is static (i.e., without parameters).
Reference:
Databricks SQL Alerts Documentation
Databricks Knowledge: "You cannot use alerts with queries that contain parameters."
NEW QUESTION # 38
What does Partner Connect do when connecting Power Bl and Tableau?
- A. Creates a Personal Access Token. downloads and installs an ODBC driver, and downloads a configuration file for connection by Power Bl or Tableau to a SQL Warehouse (formerly known as a SQL Endpoint).
- B. Creates a Personal Access Token for authentication into Databricks SQL and emails it to you.
- C. Downloads a configuration file for connection by Power Bl or Tableau to a SQL Warehouse (formerly known as a SQL Endpoint).
- D. Downloads and installs an ODBC driver.
Answer: A
Explanation:
When connecting Power BI and Tableau through Databricks Partner Connect, the system automates several steps to streamline the integration process:
Personal Access Token Creation: Partner Connect generates a Databricks personal access token, which is essential for authenticating and establishing a secure connection between Databricks and the BI tools.
ODBC Driver Installation: The appropriate ODBC driver is downloaded and installed. This driver facilitates communication between the BI tools and Databricks, ensuring compatibility and optimal performance.
Configuration File Download: A configuration file tailored for the selected BI tool (Power BI or Tableau) is provided. This file contains the necessary connection details, simplifying the setup process within the BI tool.
By automating these steps, Partner Connect ensures a seamless and efficient integration, reducing manual configuration efforts and potential errors.
NEW QUESTION # 39
A data scientist has asked a data analyst to create histograms for every continuous variable in a data set. The data analyst needs to identify which columns are continuous in the data set.
What describes a continuous variable?
- A. A categorical variable in which the number of categories continues to increase over time
- B. A quantitative variable that never stops changing
- C. A quantitative variable Chat can take on a finite or countably infinite set of values
- D. A quantitative variable that can take on an uncountable set of values
Answer: D
Explanation:
A continuous variable is a type of quantitative variable that can assume an infinite number of values within a given range. This means that between any two possible values, there can be an infinite number of other values. For example, variables such as height, weight, and temperature are continuous because they can be measured to any level of precision, and there are no gaps between possible values. This is in contrast to discrete variables, which can only take on specific, distinct values (e.g., the number of children in a family). Understanding the nature of continuous variables is crucial for data analysts, especially when selecting appropriate statistical methods and visualizations, such as histograms, to accurately represent and analyze the data.
NEW QUESTION # 40
A data analyst wants the following output:
customer_name number_of_orders
John Doe 388
Zhang San 234
Which statement will produce this output?
- A. SELECT customerjiame, count(order_id)
FROM customers
JOIN orders
ON customers.customer_id = orders.customer_id GROUP BY customerjiame; - B. SELECT customerjiame, (order_id) number_of_orders
FROM customers
JOIN orders
ON customers.customer_id = orders.customer_id; - C. SELECT customer_name, count(order_id) number_of_orders
FROM customers
JOIN orders
ON customers.customer_id = orders.customer_id USE customer_name; - D. SELECT customer_name, count(order_id) AS number_of_orders
FROM customers
JOIN orders
ON customers.customer_id = orders.customer_id
GROUP BY customer_name;
Answer: D
NEW QUESTION # 41
A data analyst has been asked to count the number of customers in each region and has written the following query:
If there is a mistake in the query, which of the following describes the mistake?
- A. The query is missing a GROUP BY region clause.
- B. There are no mistakes in the query.
- C. The query is selecting region but region should only occur in the ORDER BY clause.
- D. The query is using count('). which will count all the customers in the customers table, no matter the region.
- E. The query is using ORDER BY. which is not allowed in an aggregation.
Answer: A
Explanation:
In the provided SQL query, the data analyst is trying to count the number of customers in each region. However, they made a mistake by not including the "GROUP BY" clause to group the results by region. Without this clause, the query will not return counts for each distinct region but rather an error or incorrect result. Reference: The need for a GROUP BY clause in such queries can be understood from Databricks SQL documentation: Databricks SQL.
I also noticed that you uploaded an image with your question. The image shows a snippet of an SQL query written in plain text on a white background. The query is attempting to select regions and count customers from a "customers" table and order the results by region. There's no visible syntax highlighting or any other color - it's monochromatic. The query is the same as the one in your question. I'm not sure why you included the image, but maybe you wanted to show me the exact format of your query. If so, you can also use code blocks to display formatted content such as SQL queries. For example, you can write:
SELECT region, count(*) AS number_of_customers
FROM customers
ORDER BY region;
This way, you can avoid uploading images and make your questions more clear and concise. I hope this helps.
NEW QUESTION # 42
Which of the following approaches can be used to connect Databricks to Fivetran for data ingestion?
- A. Use Delta Live Tables to establish a cluster for Fivetran to interact with
- B. Use Workflows to establish a SQL warehouse (formerly known as a SQL endpoint) for Fivetran to interact with
- C. Use Partner Connect's automated workflow to establish a cluster for Fivetran to interact with
- D. Use Workflows to establish a cluster for Fivetran to interact with
- E. Use Partner Connect's automated workflow to establish a SQL warehouse (formerly known as a SQL endpoint) for Fivetran to interact with
Answer: C
Explanation:
Partner Connect is a feature that allows you to easily connect your Databricks workspace to Fivetran and other ingestion partners using an automated workflow. You can select a SQL warehouse or a cluster as the destination for your data replication, and the connection details are sent to Fivetran. You can then choose from over 200 data sources that Fivetran supports and start ingesting data into Delta Lake. Reference: Connect to Fivetran using Partner Connect, Use Databricks with Fivetran
NEW QUESTION # 43
A data analyst has been asked to produce a visualization that shows the flow of users through a website.
Which of the following is used for visualizing this type of flow?
- A. Sankey
- B. Heatmap
- C. IChoropleth
- D. Word Cloud
- E. Pivot Table
Answer: A
Explanation:
A Sankey diagram is a type of visualization that shows the flow of data between different nodes or categories. It is often used to represent the movement of users through a website, as it can show the paths they take, the sources they come from, the pages they visit, and the outcomes they achieve. A Sankey diagram consists of links and nodes, where the links represent the volume or weight of the flow, and the nodes represent the stages or steps of the flow. The width of the links is proportional to the amount of flow, and the color of the links can indicate different attributes or segments of the flow. A Sankey diagram can help identify the most common or popular user journeys, the bottlenecks or drop-offs in the flow, and the opportunities for improvement or optimization. Reference: The answer can be verified from Databricks documentation which provides examples and instructions on how to create Sankey diagrams using Databricks SQL Analytics and Databricks Visualizations. Reference links: Databricks SQL Analytics - Sankey Diagram, Databricks Visualizations - Sankey Diagram
NEW QUESTION # 44
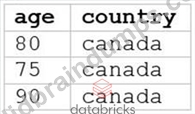
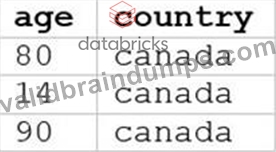
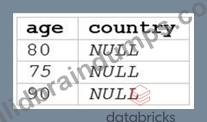
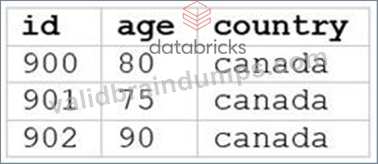
A data analyst runs the following command:
SELECT age, country
FROM my_table
WHERE age >= 75 AND country = 'canada';
Which of the following tables represents the output of the above command?
- A.
- B.
- C.
- D.

- E.
Answer: A
Explanation:
The SQL query provided is designed to filter out records from "my_table" where the age is 75 or above and the country is Canada. Since I can't view the content of the links provided directly, I need to rely on the image attached to this question for context. Based on that, Option E (the image attached) represents a table with columns "age" and "country", showing records where age is 75 or above and country is Canada. Reference: The answer can be inferred from understanding SQL queries and their outputs as per Databricks documentation: Databricks SQL
NEW QUESTION # 45
......
New (2025) Databricks Databricks-Certified-Data-Analyst-Associate Exam Dumps: https://www.validbraindumps.com/Databricks-Certified-Data-Analyst-Associate-exam-prep.html